How are the casual game portals doing?
Following up on yesterday’s post that maybe the casual games biz isn’t growing quite so explosively as some think, I decided to look closer at the one metric that is readily available for gauging performance.
Most portals are either private, or small parts of bigger entities that don’t break out results separately for games. But, since all these portals live or die based on web traffic, we can use publicly available web traffic figures as a proxy for how well the sites are doing.
The best site for researching web traffic patterns is www.alexa.com. However, it only works for sites with their own domain (i.e. www.pogo.com). For casual game portals that are subdomains of larger sites (i.e. http://games.yahoo.com/), Alexa will only give you results for the main domain (www.yahoo.com), so the games results are dwarfed within the larger site’s results, and not useful for us. Also, Alexa measures reach per million web users. If internet use as a whole grows 20%, and a given site matches that growth, then it will appear flat (I think). So, given that internet usage is obviously growing, one must assume that a flat line in Alexa does not imply no absolute growth.
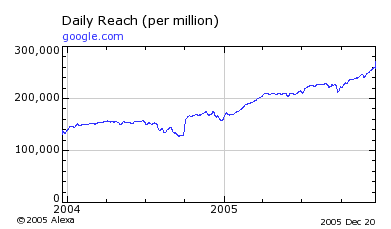
OK, so here’s a bunch of graphs looking at the performance of all the main sites that have their own unique domains. First, a quick calibration – google.com. I know they’re not a games site, but I wanted to show the graph of a very big, fast growing site, for reference:

Nice growth – looks like about 30% per year, with even faster growth in 2005 than in 2004.
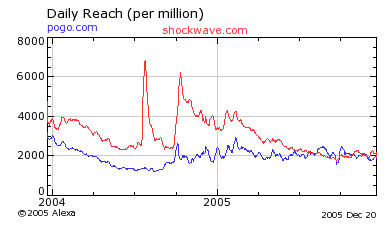
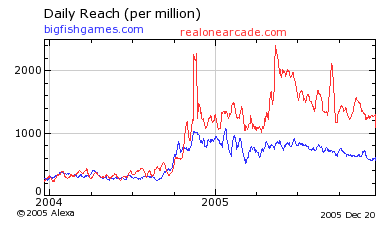
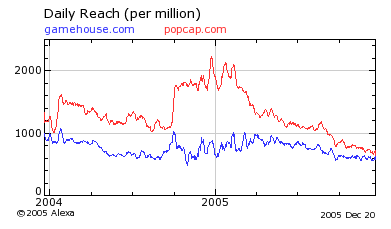
OK, now on to the casual game sites. Note that the scale on the left side is different for each of these graphs. I’ve tried to group pairs of sites that are roughly similar in size. Alexa won’t let me graph more than two at a time.


Some notes:
RealArcade uses a custom browser for many (most? all?) of their customers, and I’m not sure if Alexa measures that browser well, so the overall size of RealArcade’s traffic may be underestimated.
PopCap is a hybrid developer/publisher, with a portal-like site. But more so than the others, their traffic is driven by one or two big hits that they develop. Zuma and Bejeweled 2 both came out in 2004, causing the spike then, and they haven’t had as many games this year, partly explaining the decline.
Gamehouse is also a hybrid developer/publisher, but with less hit-driven results, thus their numbers are more steady. It’s also possible that, as casual gamers become more sophisticated, they may be shifting from publisher sites, like PopCap and Gamehouse, with a 20-40 titles on offer, to full-blown portals with 150+ titles on offer, and more frequent new titles.
Conclusions:
Unfortunately, there is little here to indicate explosive growth for this industry. Several sites saw nice growth in the second half of 2004, but from the beginning of 2005 to the present, most are flat to down.
It’s possible that this reflects a bit of a shift from users playing browser versions of the game, in which case they would revisit the sites every time they play them rather than just when they’re initially downloaded. I don’t know – I don’t have data on browser-play versus download play.
Also, it’s possible that other sites (i.e. smaller sites) are growing faster, at the expense of these sites. Again, I have no data to confirm or refute that. BigFish was supposed to be an ‘up and coming’ smaller site, and clearly they grew a tremendous amount in 2004, but, according to Alexa’s numbers anyways, that growth has stalled in 2005.
Anyways, don’t read too much into these graphs. I can’t confirm how closely Alexa traffic numbers match up to site revenues. If you know of any better (public) data sources, please let me know.
Update:
I was sent a link to this article about BigFish, which quotes non-public Media Metrix data stating that BigFish was the second fastest growing internet site in the United States in October 2005. The fact that Angel investors just put $5 million into the company would also indicate that their financials look good.
That same article also has the quote from an IDC analyst that the industry will double in size in the next two years. That one I have more doubts about – I’d like to see more evidence that the biggest portals are actually growing before I’d buy into that. Even if BigFish is growing, they are still probably #5 or #6, and likely taking share away from the other portals.
December 21st, 2005 at 3:58 pm
you might want to change the image-directory url from wp-images/ to /wp-images/
😉
December 21st, 2005 at 4:04 pm
Fixed – thanks.
December 21st, 2005 at 5:46 pm
Just so ya know Phil, Alexa is basically completely worthless for measuring traffic or site popularity. They get their numbers from their toolbar. Do you know anyone with Alexa’s toolbar installed? I sure as hell don’t.
December 21st, 2005 at 8:51 pm
To the extent that people with the Alexa toolbar don’t match the ‘net population as a whole, then comparing a site particularly favored by the types of users who also use the toolbar (Beginners?) against another site may be misleading.
But, assuming that the ‘average profile’ of Alexa toolbar users doesn’t change much over time, then Alexa is a great resource for watching a site’s change in popularity over time.
December 21st, 2005 at 9:25 pm
The average profile of Alexa users is people too foolish to not install the toolbar. Or too foolish to remove it after some site installed it without their knowledge through an ancient browser hole.
In short, it’s pretty much completely meaningless data.
December 21st, 2005 at 9:36 pm
More on topic.
One thing I realized, all of the sites I visited promise you free play *after* you sign up. with the advent of canvas and javascript based games (plus the more widespread use of Firefox) I dare to suggest that there will be a lot more sites that let you play one game immediately in your browser and then lure the user in to the paid content more gradually and seamless.
I believe there is a bunch of people that are just too reluctant to give up their email adress just for a free game to a company they haven’t had the possibility to build a trust relationship with (even if the company has an established brand name).
So casual web games can become a lot more casual (I for example don’t want to give up my email for 5 minutes of amusement), so I definitely see growth and even break-into the market opportunities there.
There may be business opportunities that can be explored, but from the graphs you are posting it sure looks like the market for the big players is solidifying – attention-wise, not money-wise.
Also I think portals like yahoo discourage people from going to other sites since they have it all there – that also may help to create the “solidifying” impression. (search for games with yahoo and first thing that pops up is yahoo-games)
Seeking money from investors right now looks like a wise idea to me since it may enable you to expand that market beyond the current scope and attract more eyeballs. not that I know anything about business, it just seems logical.
December 22nd, 2005 at 8:49 am
Alexa’s data is not a random sampling but it’s hardly “completely meaningless”. Random noise would be meaningless.
We’re talking about the casual games market here. In the absence of better data I’ll take measurements of unsophisticated computer users any day.